By Ustarminer Engineering Team
Start an AxeOS dashboard check with uptime, current jobs and accepted work, then compare hashrate, temperature and power over the same period. The fields describe different things: a counter preserves past events, a rate estimates activity over time, and a status label reports a connection condition.
Record the installed firmware and physical model. A familiar screen can appear across branches whose field definitions, sensors or averaging methods differ.
Contents

What does each type of field mean?
| Field type | Example | How to read it |
|---|---|---|
| Rate estimate | Local or pool hashrate | Identify the source and reporting window |
| Event counter | Accepted/rejected shares | Compare changes with session scope and elapsed time |
| Record | Best share | Highest difficulty reached in the stated history |
| Sensor or setpoint | ASIC temperature or core voltage | Identify location and whether it is measured or requested |
| Session/status | Runtime or online | Session time or connection state, checked alongside work |
A share total can remain visible while the current rate falls because the counter describes earlier events. After a reboot, local session fields can restart while the service retains a trailing history.
Local dashboard/OLED hashrate is a short-window estimate. A service infers rate from accepted shares over its own window. Best share is a highest-difficulty record, runtime is time since power-on or restart, and online denotes network/App connectivity. None alone certifies current accepted work.
Save the label and units as displayed. If a definition is unavailable, describe the observation narrowly rather than assigning a convenient sensor location or algorithm.
Why can local and service hashrate disagree?
Local hashrate is produced by firmware telemetry or its estimator. A service commonly estimates hashrate from qualifying shares over a selected interval. Random share timing can make the latter fluctuate when the local workload is steady.
The Bitcoin Developer Guide explains why shares meet an easier target than full blocks. Share-based estimates are useful observations, but small counts produce noisy short windows. Compare like intervals before diagnosing missing capacity.
A hypothetical device may show a stable local rate while the pool's shortest window dips. If uptime, fresh jobs and accepted work continue, extend the comparison window. If the same dip coincides with repeated restarts, the uptime evidence deserves immediate attention rather than a statistical explanation alone.
Which temperature are you reading?
ASIC, regulator, board and ambient intake temperatures are different measurements. A product's environmental operating guidance is not an internal shutdown threshold. Do not label every dashboard temperature chip junction or apply another board's safe maximum.
On current Gamma 601/602 dashboards, ASIC Temp refers to a sensor inside the chip, while Power Temp/vrTemp refers to the conversion/VR area. The default 60°C target controls fan behavior. Read alarms and protective shutdown as separate dashboard events rather than interpreting every high-temperature notification as the same action.
| Gamma condition | Alarm/protection behavior |
|---|---|
| ASIC at target +10°C for about 5 seconds | Alarm 32003; at the default target, about 70°C |
| ASIC returns to target +5°C or below for about 15 seconds | ASIC alarm clears; default 65°C or below |
| VR above 90°C for about 5 seconds | Alarm 32004 |
| VR below 90°C for about 15 seconds | VR alarm clears |
| ASIC above 75°C or VR above 105°C | Fan forced to 100%, ASIC core power disabled and hardware reset driven low |
An alarm entry is a warning event; it does not directly stop the miner. Protective cutoff is the separate action shown in the final row, and those temperatures are unsuitable as desired steady readings. Apply these definitions within the current Gamma scope and use the applicable recovery guidance after protection activates. A retained sensor value or an alarm disappearing does not alone establish normal operation.
Record intake conditions with the internal reading. A sensor at 65°C in a 30°C intake environment has a 35°C rise; the same reading in 20°C intake air has a 45°C rise. These hypothetical differences can help compare conditions but do not establish a universal acceptable limit.
Also inspect actual cooling. A comfortable-looking sensor value cannot prove that the required fan is functioning, especially if the field is stale or only one component reports speed. Dashboard interpretation complements physical observation.
How should you interpret power and efficiency?
A firmware Power field may be estimated or measured at a board-specific point. AC outlet power includes adapter losses and the required accessories. The adapter's rated output capacity is a third quantity.
The current 25°C AC references are 1.2 TH/s at 20–25W for the 601 at 525MHz/1.15V core; 602 mode 1 is 1.8 TH/s at about 38W, and mode 2 is 2.0 TH/s at about 40W. These figures include adapter conversion losses, fan and peripherals. The 36W and 48W supply ratings are output capacities.
For a hypothetical matched 27W AC and 1.5 TH/s observation:
AC efficiency = 27 ÷ 1.5 = 18 J/TH
Keep the hashrate source and interval beside that result. If the 27W comes from a firmware field with an unknown boundary, label that uncertainty instead of calling it an outlet measurement. Extra decimal places cannot supply missing calibration.
What do accepted, rejected and best-share readings tell you?
Accepted work means the service regarded a qualifying submission as valid under its rules. A rejection needs the actual reason and incident context: delayed work, identity problems and invalid results are different mechanisms.
Compare counter increments over a known period. A large total across a long session differs from a sudden spike immediately after a connection problem. Read uptime and timestamps before judging the raw number.
Best share records a previous unusually strong result. It is not a progress bar, accumulated luck or a forecast of the next hash. Clearing its history changes the record, not the work already performed or the future target.
How do you build a useful dashboard timeline?
First check whether uptime restarted. Next see whether current jobs and accepted submissions resumed. Then compare rate and temperature over that same interval, allowing for a trailing service window.
Retain the operating profile, intake conditions and meaningful events. A temperature rise followed by lower work and a restart tells a different story from an isolated rate dip. Change one relevant supported factor at a time.
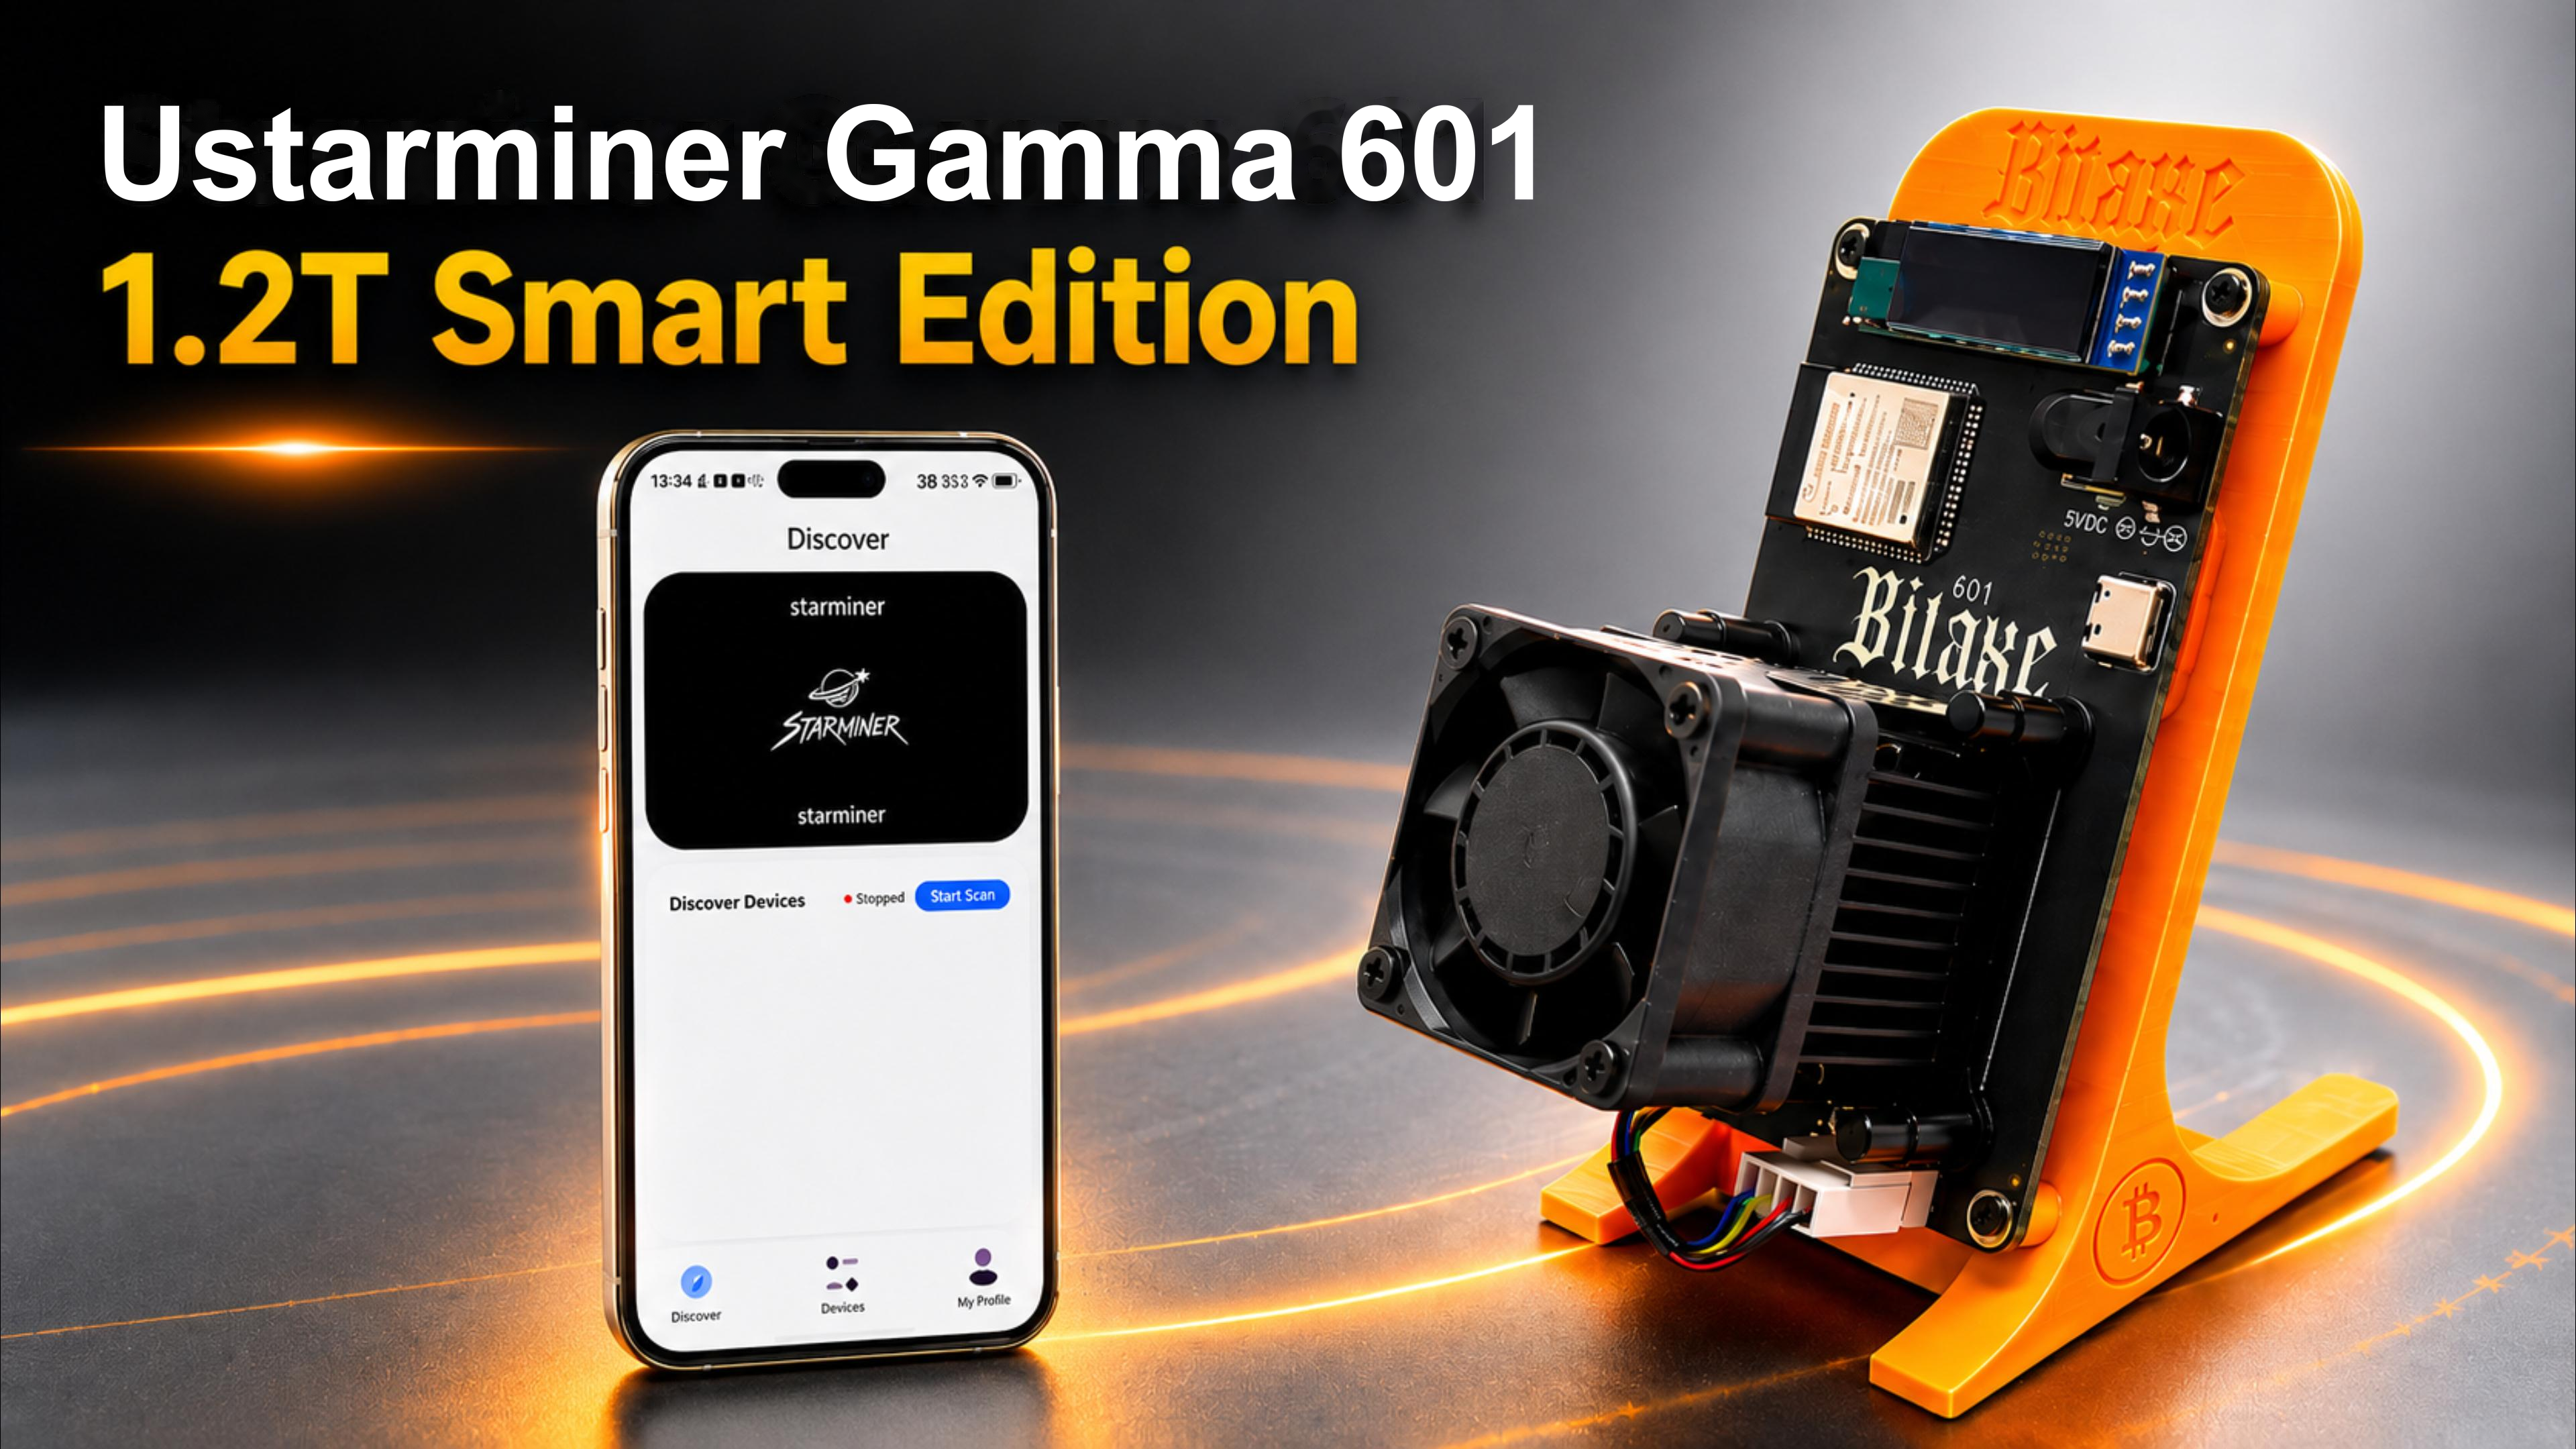
The historical Smart Edition guide provides its product context. Current 12V Gamma firmware must be model-matched through the StarMiner repository or support route. The interface alone does not establish identical field algorithms.
For persistent abnormal behavior, send official support the exact field, units, timestamp, hardware and build. State what changed together rather than guessing that the ASIC has failed.
Frequently asked questions
Is dashboard power the basis of my electricity bill?
Use AC outlet energy for the complete installation where possible. A firmware field may describe a different boundary and needs its definition before use in budgeting.
Does a lower pool estimate prove the local hashrate is false?
No. Different methods and windows can disagree temporarily. Compare appropriate periods with uptime, jobs and accepted-work evidence before drawing a conclusion.
Does a high best share mean a block is close?
No. It records a past result. It does not create progress toward a scheduled discovery or improve the next hash's chance.